
Приказ основних података о документу
Marker-trait association analysis for heading and flowering time in wheat by Single Marker Regression
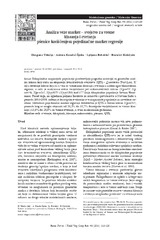
Analiza veze marker-svojstvo za vreme klasanja i cvetanja pšenice korišćenjem pojedinačne marker regresije
| dc.creator | Trkulja, Dragana | |
| dc.creator | Kondić-Špika, Ankica | |
| dc.creator | Brbaklić, Ljiljana | |
| dc.creator | Kobiljski, Borislav | |
| dc.date.accessioned | 2021-04-26T18:47:16Z | |
| dc.date.available | 2021-04-26T18:47:16Z | |
| dc.date.issued | 2011 | |
| dc.identifier.issn | 1821-3944 | |
| dc.identifier.uri | http://fiver.ifvcns.rs/handle/123456789/958 | |
| dc.description.abstract | Doubled haploid (DH) mapping populations are suitable material for genetic analysis of quantitative trait loci (QTL). In order to detect loci associated with heading and flowering time in our agro-climate region, 177 lines of DH population Savana/Renesansa were analysed with five microsatellite markers (GWM18, GWM194, GWM261, PSP3071 and PSP3200). These lines were also evaluated for heading and flowering at the experimental field of the Institute of Field and Vegetable Crops in Novi Sad. The experiment was conducted from 2003 to 2008. According to Single Marker Regression analysis, the marker GWM261 was associated with QTL which explained from 20.2% to 30.7% of the total variance for heading and from 13.6% to 28.8% of the total variance for flowering time in all analysed years. | en |
| dc.description.abstract | Dihaploidne mapirajuće populacije predstavljaju pogodan materijal za genetičku analizu lokusa koji utiču na ekspresiju kvantitativnih svojstava (QTL - Quantitative Trait Loci). U cilju detekcije lokusa koji su u vezi sa vremenom klasanja i cvetanja u našem agro-klimatskom regionu, u radu je analizirana alelna varijabilnost pet mikrosatelitskih lokusa (Xgwm18 Xgwm194, Xgwm261, Xpsp3071 i Xpsp3200) kod 177 linija dihaploidne populacije Savana/Renesansa. Pored toga, na oglednim poljima Instituta za ratarstvo i povrtarstvo u Novom Sadu u periodu 2003-2008. rađena je fenotipska evaluacija ove mapirajuće populacije za navedene osobine. Metodom pojedinačne marker regresije detektovan je QTL u blizini lokusa Xgwm261, pomoću kog se moglo objasniti od 20,2% do 30,7% fenotipske varijabilnosti za vreme klasanja i 13,6% do 28,8% za vreme cvetanja, u svim analiziranim godinama. | sr |
| dc.publisher | Institut za ratarstvo i povrtarstvo, Novi Sad | |
| dc.relation | info:eu-repo/grantAgreement/MESTD/MPN2006-2010/20138/RS// | |
| dc.rights | openAccess | |
| dc.rights.uri | https://creativecommons.org/licenses/by/4.0/ | |
| dc.source | Ratarstvo i povrtarstvo / Field and Vegetable Crops Research | |
| dc.subject | doubled haploids | en |
| dc.subject | flowering | en |
| dc.subject | heading | en |
| dc.subject | microsatellites | en |
| dc.subject | QTL | en |
| dc.subject | wheat | en |
| dc.subject | cvetanje | sr |
| dc.subject | dihaploidi | sr |
| dc.subject | klasanje | sr |
| dc.subject | mikrosateliti | sr |
| dc.subject | pšenica | sr |
| dc.subject | QTL | sr |
| dc.title | Marker-trait association analysis for heading and flowering time in wheat by Single Marker Regression | en |
| dc.title | Analiza veze marker-svojstvo za vreme klasanja i cvetanja pšenice korišćenjem pojedinačne marker regresije | sr |
| dc.type | article | |
| dc.rights.license | BY | |
| dc.citation.epage | 120 | |
| dc.citation.issue | 1 | |
| dc.citation.other | 48(1): 113-120 | |
| dc.citation.rank | M51 | |
| dc.citation.spage | 113 | |
| dc.citation.volume | 48 | |
| dc.identifier.doi | 10.5937/ratpov1101113T | |
| dc.identifier.fulltext | http://fiver.ifvcns.rs/bitstream/id/1812/955.pdf | |
| dc.type.version | publishedVersion |